North Dakota oil boom
From Wikipedia, the free encyclopedia
 the Bakken formation in the state of North Dakota that started in late 2008.[1][2] In the backdrop of the 2008–2012 global financial crisis, the oil boom has resulted in enough oil and gas jobs to give North Dakota the lowest unemployment rate in the United States.[3][4][5] There are several reasons that led to the oil boom not just in North Dakota but also nationwide. First, the recent discoveries of shale gas reserves across the nation, second, initiatives to seek energy independence from unstable sources (countries such as Venezuela and countries from the Middle East region). Finally, the successful use of horizontal drilling and hydraulic fracturing technologies. [6] The resulting sudden boom has reduced unemployment to 3.5% and given the state of North Dakota a billion-dollar budget surplus. But the industrialization and population boom has also put a strain on road, water supplies, sewage systems, and government services of the small towns and ranches in the area. Some counties have increased in population by almost double from 20,000 to 40,000 people.[7] [8] The number of rigs is expected to reach 225 by the end of 2011, with each of the rigs producing roughly 125 new jobs. This means a total growth of around 25,000 jobs, including an extra 10,000 jobs for workers who lay pipes to producing wells and produce processing plants.[8] Some estimates predict that North Dakota could have as many as 48,000 new wells, with drilling taking place over the next two to three decades. Of every dollar per barrel of oil, the state government receives 11.5 cents.[8]
Bakken Formation
Main article: Bakken formation
An April 2008 USGS report estimated the amount of technically
recoverableoil using technology readily available at the end of 2007 within the Bakken Formation at 3.0 to 4.3 billion barrels (680,000,000 m3), with a mean of 3.65 billion.[9] The state of North Dakota also released a report that month which estimated that there are 2.1 billion barrels (330,000,000 m3) of technically recoverable oil in the Bakken.[10] Various other estimates place the total reserves, recoverable and non-recoverable with today's technology, at up to 24 billion barrels. The most recent estimate places the figure at 18 billion barrels.[11] New rock fracturing technology available starting in 2008 has caused a recent boom in Bakken production. By the end of 2010 oil production rates had reached 458,000 barrels (72,800 m3) per day outstripping the capacity to ship oil out of the Bakken.[12][13] The production technology gain has led a veteran industry insider to declare that the USGS estimates are too low.[14] See also
From Wikipedia, the free encyclopedia


showing similarity to a Hubbert curve
Peak oil is the point in time when the maximum rate of petroleum extraction is reached, after which the rate of production is expected to enter terminal decline.[1] Global production of oil fell from a high point in 2005 at 74 mb/d, but has since rebounded, and 2011 figures show slightly higher levels of production than in 2005.[2] There is active debate as to how to measure peak oil, and which types of liquid fuels to include. Most of the remaining oil is from unconventional sources. Rough estimates indicate that out of an available 2 trillion barrels of oil, about half has been consumed. Peak oil is determined by the observed production rates of individual oil wells, projected reserves and the combined production rate of a field of related oil wells. In order to understand physical peak oil, the growing effort for production must be considered. Physical peak oil occurs earlier, because the overall efforts for production have increased, expanding production.[3][4] The aggregate production rate from an oil field over time usually grows until the rate peaks and then declines-sometimes rapidly- until the field is depleted. This concept is derived from the Hubbert curve, and has been shown to be applicable to the sum of a nation’s domestic production rate, and is similarly applied to the global rate of petroleum production. Peak oil is often confused with oil depletion; peak oil is the point of maximum production, while depletion refers to a period of falling reserves and supply. M. King Hubbert created and first used the models behind peak oil in 1956 to accurately predict that United States oil production would peak between 1965 and 1971.[5] His logistic model, now called Hubbert peak theory, and its variants have described with reasonable accuracy the peak and decline of production from oil wells, fields, regions, and countries,[6] and has also proved useful in other limited-resource production-domains. According to the Hubbert model, the production rate of a limited resource will follow a roughly symmetrical logistic distribution curve (sometimes incorrectly compared to a bell-shaped curve) based on the limits of exploitability and market pressures. Some observers, such as petroleum industry experts Kenneth S. Deffeyes and Matthew Simmons, predict negative global economy implications following a post-peak production decline- and oil price increase—due to the high dependence of most modern industrial transport, agricultural, and industrial systems on the low cost and high availability of oil. Predictions vary greatly as to what exactly these negative effects would be. In 2008 oil prices reached a record high of $145/barrel. Governments sought alternatives to oil, particularly the use of ethanol, but that had the unintended consequence of creating higher food prices, particularly in the developing countries. Optimistic estimations of peak production forecast the global decline will begin after 2020, and assume major investments in alternatives will occur before a crisis, without requiring major changes in the lifestyle of heavily oil-consuming nations. These models show the price of oil at first escalating and then retreating as other types of fuel and energy sources are used.[7] Pessimistic predictions of future oil production are that either the peak has already occurred,[8][9][10][dead link][11] that oil production is on the cusp of the peak, or that it will occur shortly.[12][13] The International Energy Agency (IEA) says production of conventional crude oil peaked in 2006.[14][15] Throughout the first two quarters of 2008, there were signs that a global recession was being made worse by a series of record oil prices.[16] 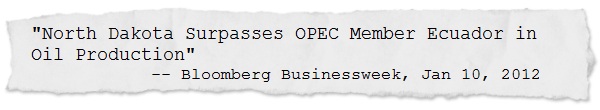  BOOMTIMES IN THE BAKKEN
http://www.smallcapinvestor.com/landing/23165/scilandbakken30orodp
Strike it Rich with 2 Emerging Bakken Drillers Now Producing Millions of Barrels of Light Sweet Crude Oil A few years ago, North Dakota wasn't even a blip on the oil industry radar. Today, thanks to the Bakken Shale Formation, the state is producing 10% of the nation's oil and is poised to pass Alaska and California in annual domestic oil production in early 2012. But as you're about to discover, the biggest growth is on the horizon - and it's not too late to stake your claim to a fortune in oil riches... UPDATE: My favorite Bakken oil stock is already up 25% since I first recommended it in late December... And with plenty of room to run, it could return 5x your money in the next 8-12 months! Fellow Investor, If you're looking for the best way to profit from the ongoing developments in the Bakken oil field, I have exciting news for you: You can end your search here and now. Some investors are under the impression that they "missed out" on the Bakken opportunity. But the truth is: the Bakken oil story is still in its infancy And while the BIG headlines from a few years ago got lots of attention..  ...the past few months have really ignited boom times in the oil-rich region of North Dakota, Montana and Saskatchewan. And the question isn't just which companies are finding oil, but rather which companies will grow the fastest? Today I'm going to tell you about two rapid growth companies drilling in the Bakken region and why they're the best opportunities for investors looking to own a piece of this historic oil formation. The Bakken oil story isn't a new one. Oil companies have been drilling in the region since the early 50s. And back in the early days, growth remained relatively flat for decades on end. The culprit? Lack of technology to get at the big oil reserves. Old drilling methods simply couldn't get into the oil kitchens locked beneath the Bakken Shale... That is, until very recently, when advanced drilling methods and the high price of oil finally made it profitable to extract the oil.... And production numbers and projections literally flew off the charts... 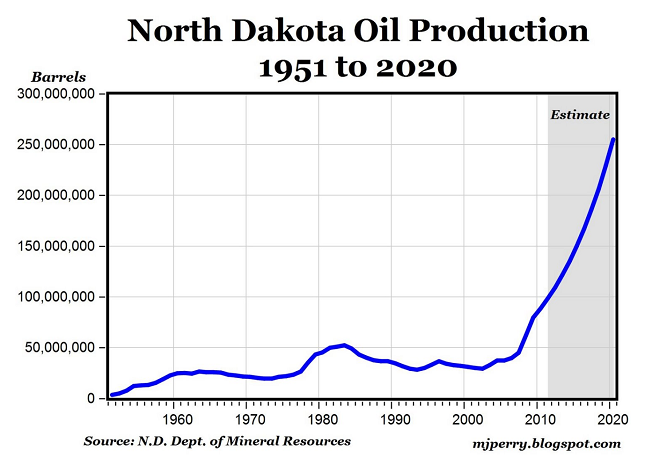 And so far, production numbers have not only been living up to expectations, but they've actually exceeded them... The growth rate has been so exceptional the North Dakota oil industry has set production records nearly every month for the past 2 years. "We just continue to see record wells being set and record rigs, record barrels being produced. The numbers show we continue to set records every month." - Alison Ritter, North Dakota Department of Mineral Resources spokeswoman And those back-to-back-to-back record-breaking months haven't only made plenty of oil money for investors, company executives and North Dakota landowners. The spike in production has also quickly made North Dakota the 4th largest oil producing state in the country.  As you can see North Dakota, a.k.a. "The Economic Miracle State", is now producing more than twice as much oil as it was just 3 years ago... and is now on pace to surpass both Alaska and California in daily production in early 2012. Yes, you read correctly - production is growing THAT quickly... And given its current rate it won't be long before Bakken oil production pushes North Dakota past Texas as the nation's number one oil producing state. In fact, at this rate, it won't be long before the Bakken region is producing the coveted... 1 Million Barrels of Oil a Day Back in 2000, North Dakota was producing less than 100,000 barrels of oil a day. Today, the same oil fields are literally GUSHING black gold, producing a staggering 488,000 barrels a day. That's a 439 percent increase in just 11 years time. I know what you may be thinking... When most people hear about that kind of growth, they automatically assume the biggest profits have already been made. But in reality Bakken oil play is still in its infancy. You see, companies are just now beginning to move significant numbers of new drilling rigs into the area because the oil reserves are so huge - potentially enough to supply the U.S. with oil for ten years and possibly more And for companies with new wells coming on line, like the 2 emerging drillers I'm about to tell you about, that means a massive and sudden increase in revenues, which will likely translate into share price appreciation. Bottom line - Bakken oil is a multi-decade boom. And we're still in the early years. Decades from now, when it's all said and done, we'll be referring to the Bakken as the world's largest continuous land-based accumulation of oil - and the most lucrative oil play this country has ever seen. You should know that North Dakota already produces more oil than OPEC member Ecuador, and the most substantial growth hasn't even been realized... yet. This year, North Dakota officials expect production to grow by 8,000 to 20,000 barrels a day each month - and that number could easily reach 600,000 barrels a day by the end of 2012 as new infrastructure gets built. And for companies with new wells coming on line, like the 2 emerging drillers I'm about to tell you about, that means a massive and sudden increase in revenues. something that usually translates into share price appreciation. One of the primary reasons North Dakota oil production is breaking records is that on a month-to-month basis, the region is... Shattering New Rig and Well Count Records And as you read this, nearly everyone with a stake in the Bakken boom is keeping a close watch on the fast-rising rig count... which is now at 204. Why is everyone fixated on the rig count? Simple: Oil companies are quickly closing in on the magic number of 250 rigs... the number of rigs that will allow North Dakota to maintain production for the next 20 years. Remember how I stated that Bakken oil production is just in its infancy? Seasoned oil executives know this - otherwise they wouldn't be positioning expensive equipment in the Bakken for the next two decades. And all these new rigs are already paying off today. They've allowed oil companies to spud 1,000 new wells in the past year alone, bringing the total number of producing wells up to 6,202. If you figure an oil company spends about $5 million to drill a well... And a well can produce up to 500,000 barrels of oil a year.... At today's prices, that's $50 million worth of oil on a $5 million investment. It's no wonder oil companies are drilling as quickly as possible to recover...
Enough Light
Sweet Crude
for the Next 100 Years
In 2008, the USGS estimated there was between 3
and 4.3 billion barrels of
recoverable oil in the Bakken.
But in light of new findings, the agency is
now planning
a revised "unscheduled" assessment in 2012 that should
substantially increase their estimates.
It's well known that current USGS estimates are extremely
conservative...
they've been raising their estimates for
years now.
On the other end of the spectrum, independent analysis from
the RAND
Corporation believes there to be 100s of billions
of barrels of
recoverable oil in the Bakken.
And they're not alone - there is considerable evidence that
supports much
higher numbers than the USGS estimates
would have you believe.
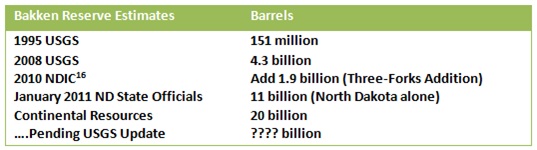
If low estimates of recoverable oil are accurate, there's
enough oil in
the Bakken to supply America's energy
needs for 10 years - and if high
estimates are correct -
there's enough to last us 50 to 100 years!
The truth is, even if only ten percent of the
Bakken's oil reserves are
recoverable, they
would double our existing domestic oil reserves.
And one thing's for sure: the companies that already
have a foothold in
the Bakken will be making money
for their investors for years to come.
Because the oil is there and the small oil drillers who
snapped up
drilling rights in the early days are just
now beginning to enjoy...
Financial crisis of 2007–2008
From Wikipedia, the free encyclopedia
(Redirected from 2008–2012 global financial crisis)
For the recession triggered by the financial crisis, see Great Recession.
The examples and perspective in this article may not represent a worldwide view of the subject. (October 2012) The TED spread (in red) increased significantly during the financial crisis, reflecting an increase in perceived credit risk. 

The financial crisis of 2007–2008, also known as the global financial crisis and 2008 financial crisis, is considered by many economists to be the worst financial crisis since the Great Depression of the 1930s.[1][2] It resulted in the threat of total collapse of large financial institutions, the bailout of banks by national governments, and downturns in stock markets around the world. In many areas, the housing market also suffered, resulting in evictions, foreclosures and prolonged unemployment. The crisis played a significant role in the failure of key businesses, declines in consumer wealth estimated in trillions of US dollars, and a downturn in economic activity leading to the 2008–2012 global recession and contributing to the European sovereign-debt crisis.[3][4] The active phase of the crisis, which manifested as a liquidity crisis, can be dated from August 7, 2007 when BNP Paribas terminated withdrawals from three hedge funds citing "a complete evaporation of liquidity".[5] The bursting of the U.S. housing bubble, which peaked in 2006,[6] caused the values of securities tied to U.S. real estate pricing to plummet, damaging financial institutions globally.[7][8] The financial crisis was triggered by a complex interplay of government policies that encouraged home ownership, providing easier access to loans for subprime borrowers, overvaluation of bundled sub-prime mortgages based on the theory that housing prices would continue to escalate, questionable trading practices on behalf of both buyers and sellers, compensation structures that prioritize short-term deal flow over long-term value creation, and a lack of adequate capital holdings from banks and insurance companies to back the financial commitments they were making.[9][10][11][12] Questions regarding bank solvency, declines in credit availability and damaged investor confidence had an impact on global stock markets, where securities suffered large losses during 2008 and early 2009. Economies worldwide slowed during this period, as credit tightened and international trade declined.[13] Governments and central banks responded with unprecedented fiscal stimulus, monetary policy expansion and institutional bailouts. In the U.S., Congress passed the American Recovery and Reinvestment Act of 2009. In the EU, the UK responded with austerity measures of spending cuts and tax increases without export growth and it has since slid into a double-dip recession.[14][15] Many causes for the financial crisis have been suggested, with varying weight assigned by experts.[16] The U.S. Senate's Levin– Coburn Report asserted that the crisis was the result of "high risk, complex financial products; undisclosed conflicts of interest; the failure of regulators, the credit rating agencies, and the market itself to rein in the excesses of Wall Street."[17] The 1999 repeal of the Glass–Steagall Act effectively removed the separation between investment banks and depository banks in the United States.[18] Critics argued that credit rating agencies and investors failed to accurately price the risk involved with mortgage-related financial products, and that governments did not adjust their regulatory practices to address 21st-century financial markets.[19] Research into the causes of the financial crisis has also focused on the role of interest rate spreads.[20] In the immediate aftermath of the financial crisis palliative fiscal and monetary policies were adopted to lessen the shock to the economy.[21] In July, 2010, the Dodd-Frank regulatory reforms were enacted to lessen the chance of a recurrence. [22] BackgroundMain article: Causes of the late-2000s financial crisisThe immediate cause or trigger of the crisis was the bursting of the United States housing bubble which peaked in approximately 2005–2006.[23][24] Already-rising default rates on "subprime" and adjustable-rate mortgages (ARM) began to increase quickly thereafter. As banks began to give out more loans to potential home owners, housing prices began to rise. Easy availability of credit in the US, fueled by large inflows of foreign funds after the Russian debt crisis and Asian financial crisis of the 1997-1998 period, led to a housing construction boom and facilitated debt-financed consumer spending. Lax lending standards and rising real estate prices also contributed to the Real estate bubble. Loans of various types (e.g., mortgage, credit card, and auto) were easy to obtain and consumers assumed an unprecedented debt load.[25] [26][27] As part of the housing and credit booms, the number of financial agreements called mortgage-backed securities (MBS) and collateralized debt obligations (CDO), which derived their value from mortgage payments and housing prices, greatly increased.[8] Such financial innovation enabled institutions and investors around the world to invest in the U.S. housing market. As housing prices declined, major global financial institutions that had borrowed and invested heavily in subprime MBS reported significant losses.[28] Falling prices also resulted in homes worth less than the mortgage loan, providing a financial incentive to enter foreclosure. The ongoing foreclosure epidemic that began in late 2006 in the U.S. continues to drain wealth from consumers and erodes the financial strength of banking institutions. Defaults and losses on other loan types also increased significantly as the crisis expanded from the housing market to other parts of the economy. Total losses are estimated in the trillions of U.S. dollars globally.[28] 
of factors caused the financial system to both expand and become increasingly fragile, a process called financialization. U.S. Government policy from the 1970s onward has emphasized deregulation to encourage business, which resulted in less oversight of activities and less disclosure of information about new activities undertaken by banks and other evolving financial institutions. Thus, policymakers did not immediately recognize the increasingly important role played by financial institutions such as investment banks and hedge funds, also known as the shadow banking system. Some experts believe these institutions had become as important as commercial (depository) banks in providing credit to the U.S. economy, but they were not subject to the same regulations.[30] These institutions, as well as certain regulated banks, had also assumed significant debt burdens while providing the loans described above and did not have a financial cushion sufficient to absorb large loan defaults or MBS losses.[31] These losses impacted the ability of financial institutions to lend, slowing economic activity. Concerns regarding the stability of key financial institutions drove central banks to provide funds to encourage lending and restore faith in the commercial paper markets, which are integral to funding business operations. Governments also bailed out key financial institutions and implemented economic stimulus programs, assuming significant additional financial commitments. The U.S. Financial Crisis Inquiry Commission reported its findings in January 2011. It concluded that "the crisis was avoidable and was caused by: Widespread failures in financial regulation, including the Federal Reserve’s failure to stem the tide of toxic mortgages; Dramatic breakdowns in corporate governance including too many financial firms acting recklessly and taking on too much risk; An explosive mix of excessive borrowing and risk by households and Wall Street that put the financial system on a collision course with crisis; Key policy makers ill prepared for the crisis, lacking a full understanding of the financial system they oversaw; and systemic breaches in accountability and ethics at all levels."[32][33] Subprime lending Main article: Subprime mortgage crisis During a period of intense competition between mortgage lenders for revenue and market share, and when the supply of creditworthy borrowers was limited, mortgage lenders relaxed underwriting standards and originated riskier mortgages to less creditworthy borrowers.[8] In the view of some analysts, the relatively conservative Government Sponsored Enterprises (GSEs) policed mortgage originators and maintained relatively high underwriting standards prior to 2003. However, as market power shifted from securitizers to originators and as intense competition from private securitizers undermined GSE power, mortgage standards declined and risky loans proliferated.[8] The worst loans were originated in 2004–2007, the years of the most intense competition between securitizers and the lowest market share for the GSEs. As well as easy credit conditions, there is evidence that competitive pressures contributed to an increase in the amount of subprime lending during the years preceding the crisis. Major U.S. investment banks and government sponsored enterprises like Fannie Mae played an important role in the expansion of lending, with GSEs eventually relaxing their standards to try to catch up with the private banks.[34][35] A contrarian view is that Fannie Mae and Freddie Mac led the way to relaxed underwriting standards, starting in 1995, by advocating the use of easy-to-qualify automated underwriting and appraisal systems, by designing the no-downpayment products issued by lenders, by the promotion of thousands of small mortgage brokers, and by their close relationship to subprime loan aggregators such as Countrywide.[36] [37] Depending on how “subprime” mortgages are defined, they remained below 10% of all mortgage originations until 2004, when they spiked to nearly 20% and remained there through the 2005–2006 peak of the United States housing bubble.[38] Some scholars, like American Enterprise Institute fellow Peter J. Wallison,[39] believe that the roots of the crisis can be traced directly to affordable housing policies initiated by HUD in the 1990s and to massive risky loan purchases by government sponsored entities Fannie Mae and Freddie Mac. Based upon information in the SEC's December 2011 securities fraud case against 6 ex-executives of Fannie and Freddie, Peter Wallison and Edward Pinto have estimated that, in 2008, Fannie and Freddie held 13 million substandard loans totaling over $2 trillion.[40] The majority report of the Financial Crisis Inquiry Commission (written by the 6 Democratic appointees without Republican participation), studies by Federal Reserve economists, and the work of several independent scholars dispute Wallison's assertions.[8] They note that GSE loans performed better than loans securitized by private investment banks, and performed better than some loans originated by institutions that held loans in their own portfolios.[8] Paul Krugman has even claimed that the GSE never purchased subprime loans – a claim that is widely disputed.[41] On September 30, 1999, The New York Times reported that the Clinton Administration pushed for more lending to low and moderate income borrowers, while the mortgage industry sought guarantees for sub-prime loans: Fannie Mae, the nation's biggest underwriter of home mortgages, has been under increasing pressure from the Clinton Administration to expand mortgage loans among low and moderate income people and felt pressure from stock holders to maintain its phenomenal growth in profits. In addition, banks, thrift institutions and mortgage companies have been pressing Fannie Mae to help them make more loans to so-called subprime borrowers... In moving, even tentatively, into this new area of lending, Fannie Mae is taking on significantly more risk, which may not pose any difficulties during flush economic times. But the government-subsidized corporation may run into trouble in an economic downturn, prompting a government rescue similar to that of the savings and loan industry in the 1980s.[42] In 2001, the independent research company, Graham Fisher & Company, stated that HUD’s 1995 “National Homeownership Strategy: Partners in the American Dream,” a 100-page affordable housing advocacy document, promoted “the relaxation of credit standards.”[43] In the early and mid-2000s (decade), the Bush administration called numerous times[44] for investigation into the safety and soundness of the GSEs and their swelling portfolio of subprime mortgages. On September 10, 2003 the House Financial Services Committee held a hearing at the urging of the administration to assess safety and soun dness issues and to review a recent report by the Office of Federal Housing Enterprise Oversight (OFHEO) that had uncovered accounting discrepancies within the two entities.[45] The hearings never resulted in new legislation or formal investigation of Fannie Mae and Freddie Mac, as many of the committee members refused to accept the report and instead rebuked OFHEO for their attempt at regulation.[46] Some believe this was an early warning to the systemic risk that the growing market in subprime mortgages posed to the U.S. financial system that went unheeded.[47] 
A 2000 United States Department of the Treasury study of lending trends for 305 cities from 1993 to 1998 showed that $467 billion of mortgage lending was made by Community Reinvestment Act (CRA)-covered lenders into low and mid level income (LMI) borrowers and neighborhoods, representing 10% of all U.S. mortgage lending during the period. The majority of these were prime loans. Sub-prime loans made by CRA-covered institutions constituted a 3% market share of LMI loans in 1998,[48] but in the run-up to the crisis, fully 25% of all sub-prime lending occurred at CRA-covered institutions and another 25% of sub-prime loans had some connection with CRA.[49] In addition, an analysis by the Federal Reserve Bank of Dallas in 2009, however, concluded that the CRA was not responsible for the mortgage loan crisis, pointing out that CRA rules have been in place since 1995 whereas the poor lending emerged only a decade later.[50] Furthermore, most sub-prime loans were not made to the LMI borrowers targeted by the CRA, especially in the years 2005–2006 leading up to the crisis. Nor did it find any evidence that lending under the CRA rules increased delinquency rates or that the CRA indirectly influenced independent mortgage lenders to ramp up sub-prime lending. To other analysts the delay between CRA rule changes (in 1995) and the explosion of subprime lending is not surprising, and does not exonerate the CRA. They contend that there were two, connected causes to the crisis: the relaxation of underwriting standards in 1995 and the ultra-low interest rates initiated by the Federal Reserve after the terrorist attack on September 11, 2001. Both causes had to be in place before the crisis could take place.[51] Critics also point out that publicly-announced CRA loan commitments were massive, totaling $4.5 trillion in the years between 1994 and 2007.[52] They also argue that the Federal Reserve’s classification of CRA loans as “prime” is based on the faulty and self-serving assumption: that high-interest-rate loans (3 percentage points over average) equal “subprime” loans.[53] Economist Paul Krugman argued in January 2010 that the simultaneous growth of the residential and commercial real estate pricing bubbles and the global nature of the crisis undermines the case made by those who argue that Fannie Mae, Freddie Mac, CRA, or predatory lending were primary causes of the crisis. In other words, bubbles in both markets developed even though only the residential market was affected by these potential causes.[54] In his Dissent to the Financial Crisis Inquiry Commission, Peter J. Wallison wrote: "It is not true that every bubble- even a large bubble—has the potential to cause a financial crisis when it deflates." Wallison notes that other developed countries had "large bubbles during the 1997-2007 period" but "the losses associated with mortgage delinquencies and defaults when these bubbles deflated were far lower than the losses suffered in the United States when the 1997-2007 [bubble] deflated." According to Wallison, the reason the U.S. residential housing bubble (as opposed to other types of bubbles) led to financial crisis was that it was supported by a huge number of substandard loans - generally with low or no downpayments.[55] Others have pointed out that there were not enough of these loans made to cause a crisis of this magnitude. In an article in Portfolio Magazine, Michael Lewis spoke with one trader who noted that "There weren’t enough Americans with [bad] credit taking out [bad loans] to satisfy investors' appetite for the end product ." Essentially, investment banks and hedge funds used financial innovation to enable large wagers to be made, far beyond the actual value of the underlying mortgage loans, using derivatives called credit default swaps, collateralized debt obligations and synthetic CDOs.[56] As of March 2011 the FDIC has had to pay out $9 billion to cover losses on bad loans at 165 failed financial institutions.[57] The Congressional Budget Office estimated, in June 2011, that the bailout to Fannie Mae and Freddie Mac exceeds $300 billion (calculated by adding the fair value deficits of the entities to the direct bailout funds at the time).[58] | ||||
Minggu, 06 Januari 2013
...North Dakota oil boom...>>> the Bakken formation in the state of North Dakota that started in late 2008.[1][2] In the backdrop of the 2008–2012 global financial crisis, the oil boom has resulted in enough oil and gas jobs to give North Dakota the lowest unemployment rate in the United States.[3][4][5] There are several reasons that led to the oil boom not just in North Dakota but also nationwide. First, the recent discoveries of shale gas reserves across the nation, second, initiatives to seek energy independence from unstable sources (countries such as Venezuela and countries from the Middle East region). Finally, the successful use of horizontal drilling and hydraulic fracturing technologies. [6] The resulting sudden boom has reduced unemployment to 3.5% and given the state of North Dakota a billion-dollar budget surplus. But the industrialization and population boom has also put a strain on road, water supplies, sewage systems, and government services of the small towns and ranches in the area. Some counties have increased in population by almost double from 20,000 to 40,000 people.[7] [8]...>>>...Strike it Rich with 2 Emerging Bakken Drillers Now Producing Millions of Barrels of Light Sweet Crude Oil A few years ago, North Dakota wasn't even a blip on the oil industry radar. Today, thanks to the Bakken Shale Formation, the state is producing 10% of the nation's oil and is poised to pass Alaska and California in annual domestic oil production in early 2012. But as you're about to discover, the biggest growth is on the horizon - and it's not too late to stake your claim to a fortune in oil riches... ..>>>
Langganan:
Posting Komentar (Atom)
BalasHapusYour Net Worth Will Be More Than Halved After This…
Your Savings Will Be Worthless After China Does This
China Will Destroy Your Net Worth
Did you know that China is USA’s largest debt holder?
This means that all they need to do start devaluing the US Dollar is by selling their debt holdings to their secondary market.
This means the US Dollar value itself will crumble.
Some financial analysts have stated that the USD will more than halve in value over the next few months.
Are you and your family prepared?
Make sure you don’t let your net worth and savings be rendered worthless.
>>[Watch This Video To Learn How To Profit From This Downfall]<<
However, it’s not all bad news.
There’s a way that you can actually PROFIT from the fall of the US dollar and also any other economic collapse in the future.
Just click on the video before and learn how you can join the 1% of the elite that makes money each time there is an economic downturn.
>>[Watch This Video To Learn How To Profit From This Downfall]<<
Speak soon.
[Mr Mark Fidelman]