Attention Passengers on Global Equity Flight 2011: Assume Crash Positions
I
know, I know, retail sales are up so everything's wunnerful, but the
captain of Global Equities Flight 2011 just instructed the passengers to
assume crash positions. It seems the captain has the distinct advantage
of being able to see what's just ahead, not to mention being able to
monitor the engines and fuel levels. (Hmm, did the starboard engine just
conk out? Not good....)
Levity aside, there are unnerving similarities between the present and the pre-crash 2008 equities market. To make the case, let's turn to some excellent charts from The Chart Store and Ron Griess.
In the
first chart, Ron has traced out the basic pattern and the percentage of
stocks above their 200-day moving average (MA). Notice how weak that is
compared to price.
Next, a chart which shows we're right where the 2008 rally topped and tanked.
Last up,
one of my favorites, an analog chart that overlays the present-day rally
over the 1907 crash and rally. It is uncannily similar until QE2 saved
the day for a few months. That pushed the present out beyond the 1907
line, but then current prices began falling until the most recent
"6-week wonder" prop job once again saved equities from collapse.
Apparently
we're supposed to believe that channel-stuffing auto dealers and
Americans-self-medicating-with-shopping-on-credit are really going to
power the economy to ever greater heights of sales and profits.
Anything's possible, but despite the cheer and the constant calls for a
year-end rally to end all rallies, the market is looking a little
uncertain here.
Consider
the broad-based Russell 2000, which seems to have traced out a beautiful
head and shoulders pattern, as good a precursor to a crash as you can
get.
The last
time the RUT looked this ugly, the Powers That Be pulled one save after
another out of their bag of tricks. Despite brave talk from Fed lackeys
that "we have more amazing stimulus plans right here," everyone knows
they've shot their wad and have been reduced to playing around with
Treasury yields that won't do anything for the real economy. So all that
brave talk about the next big Fed-rides-to-the-rescue is just that, hot
air and paper-thin bravado.
For a very insightful chart of the RUT from a razor-sharp analyst, please see Technical Perspective: Repetition in the Russell 2000 (Chris Kimble).
Zooming
in a bit, let's take a look at the S&P 500, where we see a classic
wedge/pennant, the sort of thing that breaks big up or down. Given the
abundant evidence of weakness, not to mention the potential for outright
panic in global credit markets, does anyone not being paid to lie
really think the probabilities favor a breakout here to the upside?
Based on what? I know, I know, "seasonal patterns." In other words,
we're depending on Santa to deliver the rally everyone needs to stay
solvent.
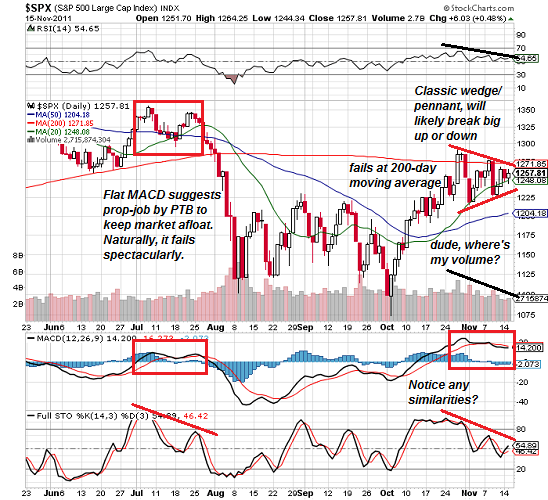
It
doesn't take much imagination--none, really--to see the similarities
between the July topping-out and the present. If volume is the weapon of
the Bull, then everyone betting on the next big rally has to explain
why volume has been declining.
Rather
than get distracted with how much low-quality crap gets sold at
loss-leader prices on November 25, we might be better served to focus on
the U.S. dollar. As
everyone knows, equities and the buck have been on a see-saw for a long
time. If the dollar rises, equities drop. If the dollar rises a
lot--for any reason, or no reason, it doesn't matter-- then equities
crash.
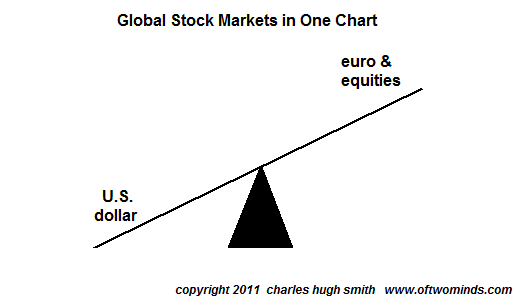
If the euro weakens, the dollar rises. If the dollar rises, equities weaken. If there is anything else to know about the current equity market, how much can it possibly be worth?
He who sells first sells best. Something to ponder in the weeks ahead.
*Post courtesy of Charles Hugh Smith at Of Two Minds.
Tidak ada komentar:
Posting Komentar