World Uranium Mining Production
(Updated July 2013)http://www.world-nuclear.org/
- About 64 percent of the world's production of uranium from mines is from Kazakhstan, Canada and Australia.
- An increasing proportion of uranium, now 45%, is produced by in situ leaching.
- After a decade of falling mine production to 1993, output of uranium has generally risen since then and now meets 86% of demand for power generation.
Production from mines (tonnes U)
| Country | 2005 | 2006 | 2007 | 2008 | 2009 | 2010 | 2011 | 2012 |
|---|---|---|---|---|---|---|---|---|
| Kazakhstan | 4357 | 5279 | 6637 | 8521 | 14020 | 17803 | 19451 | 21317 |
| Canada | 11628 | 9862 | 9476 | 9000 | 10173 | 9783 | 9145 | 8999 |
| Australia | 9516 | 7593 | 8611 | 8430 | 7982 | 5900 | 5983 | 6991 |
| Niger (est) | 3093 | 3434 | 3153 | 3032 | 3243 | 4198 | 4351 | 4667 |
| Namibia | 3147 | 3067 | 2879 | 4366 | 4626 | 4496 | 3258 | 4495 |
| Russia | 3431 | 3262 | 3413 | 3521 | 3564 | 3562 | 2993 | 2872 |
| Uzbekistan | 2300 | 2260 | 2320 | 2338 | 2429 | 2400 | 2500 | 2400 |
| USA | 1039 | 1672 | 1654 | 1430 | 1453 | 1660 | 1537 | 1596 |
| China (est) | 750 | 750 | 712 | 769 | 750 | 827 | 885 | 1500 |
| Malawi | 104 | 670 | 846 | 1101 | ||||
| Ukraine (est) | 800 | 800 | 846 | 800 | 840 | 850 | 890 | 960 |
| South Africa | 674 | 534 | 539 | 655 | 563 | 583 | 582 | 465 |
| India (est) | 230 | 177 | 270 | 271 | 290 | 400 | 400 | 385 |
| Brazil | 110 | 190 | 299 | 330 | 345 | 148 | 265 | 231 |
| Czech Republic | 408 | 359 | 306 | 263 | 258 | 254 | 229 | 228 |
| Romania (est) | 90 | 90 | 77 | 77 | 75 | 77 | 77 | 90 |
| Germany | 94 | 65 | 41 | 0 | 0 | 8 | 51 | 50 |
| Pakistan (est) | 45 | 45 | 45 | 45 | 50 | 45 | 45 | 45 |
| France | 7 | 5 | 4 | 5 | 8 | 7 | 6 | 3 |
| total world | 41 719 | 39 444 | 41 282 | 43 764 | 50 772 | 53 671 | 53 493 | 58 394 |
| tonnes U3O8 | 49 199 | 46 516 | 48 683 | 51 611 | 59 875 | 63 295 | 63 084 | 68 864 |
| percentage of world demand* | 65% | 63% | 64% | 68% | 78% | 78% | 85% | 86% |
*WNA Market Report data
Mining methods have been changing. In 1990, 55% of world production
came from underground mines, but this shrunk dramatically to 1999, with
33% then. From 2000 the new Canadian mines increased it again, and with
Olympic Dam it is now 37%. In situ leach (ISL, or ISR) mining has been
steadily increasing its share of the total, mainly due to Kazakhstan. In
2012 production was as follows:| Method | tonnes U | % |
| Conventional underground (except Olympic Dam)* | 16,324 | 27.9% |
| Conventional open pit | 11,906 | 20.4% |
| In situ leach (ISL) | 26,263 | 45.0% |
| By-product* | 3851 | 6.6% |
* Considering Olympic Dam as by-product rather than in underground category
Conventional mines have a mill where the ore is crushed, ground and
then leached with sulfuric acid to dissolve the uranium oxides. At the
mill of a conventional mine, or the treatment plant of an ISL operation,
the uranium then separated by ion exchange before being dried and
packed, usually as U3O8.
Some mills and ISL operations use carbonate leaching instead of sulfuric
acid, depending on the orebody. Where uranium is recovered as a
by-product, eg of copper or phosphate, the treatment process is likely
to be more complex.
During the 1990s the uranium production industry was consolidated by
takeovers, mergers and closures, but this has diversified in recent
years with Kazakhstan's diverse ownership structure. In 2012, eight
companies marketed 88% of the world's uranium mine production:
| Company | tonnes U | % | |
| KazAtomProm | 8863 | 15 | |
| Areva | 8641 | 15 | |
| Cameco | 8437 | 14 | |
| ARMZ - Uranium One | 7629 | 13 | |
| Rio Tinto | 5435 | 9 | |
| BHP Billiton | 3386 | 6 | |
| Paladin | 3056 | 5 | |
| Navoi | 2400 | 4 | |
| Other | 10,548 | 18 | |
| Total | 58 394 | 100% |
The largest-producing uranium mines in 2012 were:
| Mine | Country | Main owner | Type | Production (tU) | % of world | ||||
| McArthur River | Canada | Cameco | underground | 7520 | 13 | ||||
|---|---|---|---|---|---|---|---|---|---|
| Olympic Dam | Australia | BHP Billiton | by-product/ underground |
3386 | 6 | ||||
| Ranger | Australia | ERA (Rio Tinto 68%) | open pit | 3146 | 5 | ||||
| Arlit | Niger | Somair/ Areva | open pit | 3065 | 5 | ||||
| Tortkuduk (est) | Kazakhstan | Katco JV/ Areva | ISL | 2661 | 5 | ||||
| Rossing | Namibia | Rio Tinto (69%) | open pit | 2289 | 4 | ||||
| Budenovskoye 2 | Kazakhstan | Karatau JV/Kazatomprom-Uranium One | ISL | 2135 | 4 | ||||
| Kraznokamensk | Russia | ARMZ | underground | 2011 | 3 | ||||
| Langer Heinrich | Namibia | Paladin | open pit | 1955 | 3 | ||||
| South Inkai | Kazakhstan | Betpak Dala JV/ Uranium One | ISL | 1870 | 3 | ||||
| Inkai | Kazakhstan | Inkai JV/Cameco | ISL | 1701 | 3 | ||||
| Central Mynkuduk | Kazakhstan | Ken Dala JV/ Kazatomprom | ISL | 1622 | 3 | ||||
| Akouta | Niger | Cominak/ Areva | underground | 1506 | 3 | ||||
| Rabbit Lake | Canada | Cameco | underground | 1479 | 3 | ||||
| Budenovskoye 1&3 | Kazakhstan | Akbastau JV/ Kazatomprom-Uranium One | ISL | 1203 | 2 | ||||
| Top 15 total | 37 549 | 64% | |||||||

Source:World Nuclear Association
New Mines
Since the recovery of uranium prices since about 2003, there has been
a lot of activity in preparing to open new mines in many countries. The
WNA reference scenario projects world uranium demand as about 72,680 tU
in 2015, and most of this will need to come directly from mines (in
2010, 22% came from secondary sources and this shrunk to 14% in 2012).
Some of the new mines expected to reach substantial production in the next few years are:
| Vitimsky | Russia | 2013 |
| Four Mile | Australia | 2013 |
| Cigar Lake | Canada | 2013 |
| Talvivaara (by-product) | Finland | 2014 |
| Imouraren | Niger | 2015 |
| Husab | Namibia | 2015 |
Estimated future production from existing mines plus new projects
such as these is however not sufficient to meet the demand requirements
to 2030 in the WNA 2011 Market Report (2030 demand 137,000 tU in upper
scenario, 108,000 tU in reference scenario; 2030 primary production
97,000 tU in upper scenario, 89,000 tU in reference scenario). However,
price signals leading to increased production and also secondary
sources will close the gap.
Known Recoverable Resources of Uranium 2011
http://www.world-nuclear.org/Nuclear-Basics/
| tonnes U | percentage of world | |
| Australia |
1,661,000
|
31%
|
|---|---|---|
| Kazakhstan |
629,000
|
12%
|
| Russia |
487,200
|
9%
|
| Canada |
468,700
|
9%
|
| Niger |
421,000
|
8%
|
| South Africa |
279,100
|
5%
|
| Brazil |
276,700
|
5%
|
| Namibia |
261,000
|
5%
|
| USA |
207,400
|
4%
|
| China |
166,100
|
3%
|
| Ukraine |
119,600
|
2%
|
| Uzbekistan |
96,200
|
2%
|
| Mongolia |
55,700
|
1%
|
| Jordan |
33,800
|
1%
|
| other |
164,000
|
3%
|
| World total |
5,327,200
|
Reasonably Assured Resources plus Inferred Resources, to US$ 130/kg U, 1/1/11, from OECD NEA & IAEA, Uranium 2011: Resources, Production and Demand ("Red Book").
The total to US$ 260/kg U is 7,096,600 tonnes U, and Namibia moves up ahead of Niger.
The total to US$ 260/kg U is 7,096,600 tonnes U, and Namibia moves up ahead of Niger.
Sources:
Nuclear Basics
Answering some of the key questions about nuclear energy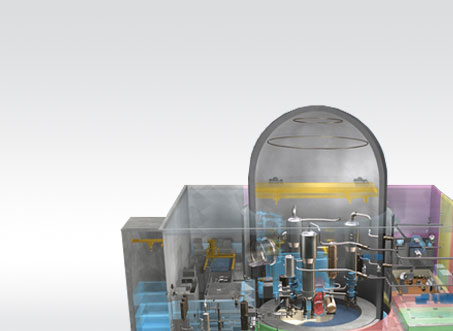
Did you know...?
Nuclear energy is used to generate around
11% of the world's electricity, with almost no greenhouse gas emissions.

Did you know...?
A single uranium fuel pellet contains as
much energy as 480 cubic metres of natural gas, 807 kilos of coal or 149
gallons of oil.

Did you know...?
Nuclear energy is used by more than 30
countries around the world. Nuclear technologies have many uses,
including powering Mars rovers.
Did you know...?
Nuclear power plants can generate
electricity continuously for many months at a time, without
interruption.
- Global number of nuclear reactors
- Electricity supplied by nuclear energy
- Greenhouse gas emissions avoided
- Glossary
Electricity generation - what are the options?
Every form of electricity generation has its
strengths and weakness. The global demand for electricity is rising, and
future electricity generation will need a range of options, although
they must be low carbon if greenhouse gas emissions are to be reduced.
Nuclear generation provides reliable supplies of electricity, with very
low carbon emissions and relatively small amounts of waste that can be
safely stored and eventually disposed of.
Electricity is vital to modern life. It powers our lights and
appliances at home. It powers many industry processes. It is used to
power trains and to charge electric vehicles.
Globally, electricity use is rising rapidly as new major economies develop in places such as China and India.
This need for electricity drives a growing demand for electricity
generation, with thousands of new power plants needed across the world
over the coming decades.
For many decades almost all the electricity consumed in the world has
been generated from three different forms of power plant - fossil,
hydro and nuclear. Renewables currently generate a relatively small
share of the world's electricity, although that share is growing fast.
Fossil
Fossil fuel power plants burn carbon fuels such coal, oil or gas to
generate steam that drives large turbines that produce electricity.
These plants can generate electricity reliably over long periods of
time. However, by burning carbon fuels they produce large amounts carbon
dioxide, which causes climate change. They can also produce other pollutants, such as sulphurous oxides, which cause acid rain.

Fossil fuel plants require huge quantities of coal, oil or gas. These
fuels may need to be transported over long distances. The price of
fuels can rise sharply at times of shortage, leading to unstable
generation costs.
Large hydro
Large hydro power plants generate electricity by storing water in
vast reservoirs behind massive dams. Water from the dams flows through
turbines to generate electricity, and then goes on to flow through
rivers below the dam.
Hydro dams can generate large amounts of electricity. However, dry
periods can drain the reservoirs. The flooding of reservoirs behind dams
and slowing of the flow of the river below the dam can have a serious
impact on the ecology around the dam. The number of sites suitable for
new dams is limited.
Nuclear
Nuclear power plants use the heat produced by nuclear fission to
generate steam that drives turbines, like in fossil fuel plants.
However, no greenhouse gases are produced in this fission process, and
only small amounts are produced across the whole fuel cycle.
Nuclear fuel can be used in a reactor for several years. The used
fuel that remains after this time must be stored and then either
recycled to make new fuel or carefully
disposed of. However, because the amount of fuel used to generate
electricity is so much less than that used in fossil fuel plants it is
much more practical to do this with used nuclear fuel than with the
wastes and emissions from fossil fuels.
Nuclear power plants can run for many months without interruption, providing reliable and predictable supplies of electricity.
Nuclear
power plants can generate electricity "24/7" for many months at a time,
without interruption. Nuclear generation is one of the safest and least
environmentally damaging forms of electricity generation
Renewables
Renewables such as wind, solar and small scale hydro produce
electricity with no greenhouse gas emissions at the point of generation
and very low amounts of greenhouse gas emissions across their
entire lifecycle.
The cost of electricity generation from many renewables tends to be
higher than other forms of generation, often requiring subsidies to
compete with other forms of generation, although these costs are coming
down.
Many renewables do not produce electricity predictably or
consistently. Electricity generation from wind turbines varies with the
wind speed, and if that wind is too weak or too strong no electricity is
produced at all. The output of solar panels is reliant on the strength
of the sunshine, which depends on the time of day and the amount of
cloud cover. This means that renewables have to be backed up
by other forms of electricity generation, often fossil fuel generation
with their resultant greenhouse gas emissions.
What is radiation?
http://www.world-nuclear.org/Nuclear-Basics/What-is-radiation-/#.UhbYHn-N6So
Radiation is energy travelling through space.
Sunshine is one of the most familiar forms of radiation. It
delivers light, heat and suntans. While enjoying and
depending on it, we control our exposure to it.
Beyond ultraviolet radiation from the sun are higher-energy
kinds of radiation which are used in medicine and which we all get
in low doses from space, from the air, and from the earth and
rocks.
Collectively we can refer to these kinds of radiation
as ionising radiation. It can cause
damage to matter, particularly living tissue. At high levels
it is therefore dangerous, so it is necessary to control our
exposure.
While we cannot feel this radiation, it is readily detected and measured, and exposure can easily be monitored.
Living things have evolved in an environment which has significant levels of ionising radiation.

Furthermore, many people owe their lives and health to such
radiation produced artificially. Medical and dental X-rays
discern hidden problems. Other kinds of ionising radiation
are used to diagnose ailments, and some people are treated with
radiation to cure disease.
Ionising radiation, such as occurs from uranium ores and nuclear
wastes, is part of our human environment, and always has been so.
At high levels it is hazardous, but at low levels such as we all
experience naturally, it is harmless. Considerable effort is
devoted to ensuring that those working with nuclear power are not
exposed to harmful levels of radiation from it. Standards for
the general public are set about 20 times lower still, well below
the levels normally experienced by any of us from natural
sources.

Background radiation is that ionizing radiation which is
naturally and inevitably present in our environment. Levels
of this can vary greatly. People living in granite areas or
on mineralised sands receive more terrestrial radiation than
others, while people living or working at high altitudes receive
more cosmic radiation. A lot of our natural exposure is due
to radon, a gas which seeps from the Earth's crust and is present
in the air we breathe.
Radioactivity in material
Apart from the normal measures of mass and volume, the amount of
radioactive material is measured
in Becquerel (Bq), which enables us to
compare the typical radioactivity of some natural and other
materials. A Becquerel is one atomic decay per second, so a
household smoke detector with 30,000 Bq contains enough americium
to produce that much disintegration per second. A kilogram of
coffee or granite might have 1000 Bq of activity and an adult human
7000 Bq. Each atomic disintegration produces some ionizing
radiation.
Ionising radiation - alpha, beta and gamma
Ionising radiation comes from the nuclei of atoms, the basic
building blocks of matter. Most atoms are stable, but certain atoms
change or disintegrate into totally new atoms. These kinds of atoms
are said to be 'unstable' or 'radioactive'. An unstable atom has
excess internal energy, with the result that the nucleus can
undergo a spontaneous change. This is called 'radioactive
decay'.We all experience radiation from natural sources every day
An unstable nucleus emits excess energy as radiation in the form
of gamma rays or fast-moving sub-atomic particles. If it
decays with emission of an alpha or beta particle, it becomes a new
element. One can describe the emissions as gamma, beta and
alpha radiation. All the time, the atom is progressing in one
or more steps towards a stable state where it is no longer
radioactive.
Alpha particles consist of two
protons and two neutrons, in the form of atomic nuclei. Alpha particles
are doubly charged (arising from the charge of the two protons). This
charge and the relatively slow speed and high mass of alpha particles
means that they interact more readily with matter than beta particles or
gamma rays and lose their energy quickly. They therefore have little
penetrating power and can be stopped by the first layer of skin or
a sheet of paper. But inside the body they can inflict more
severe biological damage than other types of radiation.
Beta particles are fast-moving
electrons ejected from the nuclei of many kinds of radioactive
atoms. These particles are singly charged (the charge of an electron),
are lighter and ejected at a much faster speed than alpha particles.
They can penetrate up to 1 to 2 centimetres of water or human
flesh. They can be stopped by a sheet of aluminium a few
millimetres thick.
Gamma rays, like light, represent energy
transmitted in a wave without the movement of material, just like
heat and light. Gamma rays and X-rays are virtually identical
except that X-rays are generally produced artificially rather than
coming from the atomic nucleus. But unlike light, these rays
have great penetrating power and can pass through the human body.
Mass in the form of concrete, lead or water is used to shield us
from them.

The effective dose of all these kinds of radiation is measured in a
unit called the Sievert, although most doses experienced are much lower
than a Sievert, so figures are given in millisieverts (mSv), which are
one-thousandth of a Sievert.
How uranium ore is made into nuclear fuel
http://www.world-nuclear.org/Nuclear-Basics/How-is-uranium-ore-made-into-nuclear-fuel-/#.UhbYu3-N6So
Uranium is a naturally-occurring element in the Earth's crust. Traces
of it occur almost everywhere, although mining takes place in locations
where it is naturally concentrated. To make nuclear fuel from the
uranium ore requires first for the uranium to be extracted from the rock
in which it is found, then enriched in the uranium-235 isotope, before
being made into pellets that are loaded into the nuclear fuel assembly.
Mining
Uranium mines operate in some twenty countries, though about
half of world production comes from just ten mines in six
countries, in Canada, Australia, Niger, Kazakhstan, Russia and Namibia.
At conventional mines, the ore goes through a mill where it is
first crushed. It is then ground in water to
produce a slurry of fine ore particles suspended in the
water. The slurry is leached with sulphuric acid to dissolve
the uranium oxides, leaving the remaining rock and other minerals undissolved.
However, nearly half the world's mines now
use a mining method is in sit leaching (ISL). This means that the
mining is accomplished without any major ground disturbance.
Groundwater with a lot of oxygen injected into it is circulated through
the uranium ore, extracting the uranium. The solution with dissolved
uranium is pumped to the surface.
Both mining methods produce a liquid with
uranium dissolved in it. This is filtered and the uranium then separated
by ion exchange, precipitated from the solution, filtered and dried to
produce a uranium oxide concentrate (U3O8), which is then sealed in drums. This concentrate is a bright yellow colour, and is known as 'yellowcake'.
The U3O8 is only mildly radioactive. (The radiation level one metre from a drum of freshly-processed U3O8 is about half that - experienced from cosmic rays - on a commercial jet flight.)

U3O8 or Yellowcake
Enrichment
The vast majority of all nuclear power reactors require
'enriched' uranium fuel in which the proportion of the
uranium-235 isotope has been raised from the natural level of 0.7%
to about 3.5% to 5%. The enrichment process needs to have the
uranium in gaseous form, so on the way from the mine it goes
through a conversion plant which turns the uranium oxide into
uranium hexafluoride (UF6).
The enrichment plant removes about 85% of the uranium by
separating gaseous uranium hexafluoride into two streams: One
stream is enriched to the required level and then passes to the
next stage of the fuel cycle. The other stream is depleted
in U-235 and is called 'tails'. It is mostly uranium-238 and
has little immediate use.
Today's enrichment plants use the centrifuge process, with
thousands of rapidly-spinning vertical tubes. Research is being
conducted into laser enrichment, which appears to be a promising
new technology.
A small number of reactors, notably the Canadian CANDU reactors,
do not require uranium to be enriched.
Fuel fabrication
27 tonnes of fresh fuel is required each year
by a 1000 MWe nuclear reactor. In contrast, a coal power station
requires more than two and a half million tonnes of coal to produce as
much electricity. (1)Enriched UF6 is transported to a fuel fabrication plant where it is converted to uranium dioxide (UO2)
powder. This powder is then pressed to form small fuel pellets, which
are then heated to make a hard ceramic material. The pellets are then
inserted into thin tubes to form fuel rods. These fuel rods are then
grouped together to form fuel assemblies, which are several meters
long.
The number of fuel rods used to make each fuel assembly depends on
the type of reactor. A PWR (pressurised water reactor) may use between
121-193 fuel assemblies, each consisting of between 179-264 fuel rods. A
BWR (boiling water reactor) has between 91-96 fuel rods per assembly,
with between 350-800 fuel assemblies per reactor.
.
Nuclear Fuel Assembly
How a nuclear reactor makes electricity
http://www.world-nuclear.org/Nuclear-Basics/How-does-a-nuclear-reactor-make-electricity-/#.UhbZan-N6So
A nuclear reactor produces and controls the release of energy
from splitting the atoms of uranium.
Uranium-fuelled nuclear power is a clean and efficient way of
boiling water to make steam which drives turbine generators. Except
for the reactor itself, a nuclear power station works like most
coal or gas-fired power stations.
The Reactor Core
Several hundred fuel assemblies containing thousands of small
pellets of ceramic uranium oxide fuel make up the core of a
reactor. For a reactor with an output of 1000 megawatts
(MWe), the core would contain about 75 tonnes of enriched
uranium.
In the reactor core the U-235 isotope fissions or splits,
producing a lot of heat in a continuous process called a chain
reaction. The process depends on the presence of a moderator
such as water or graphite, and is fully controlled.
The moderator slows down the neutrons produced by fission of the
uranium nuclei so that they go on to produce more fissions.

Two examples of fission of a Uranium-235 atom
Some of the U-238 in the reactor core is turned into plutonium
and about half of this is also fissioned similarly, providing about
one third of the reactor's energy output.
The fission products remain in the ceramic fuel and undergo
radioactive decay, releasing a bit more heat. They are the
main wastes from the process.
The reactor core sits inside a steel pressure vessel, so that
water around it remains liquid even at the operating temperature of
over 320°C. Steam is formed either above the reactor core or
in separate pressure vessels, and this drives the turbine to
produce electricity. The steam is then condensed and the
water recycled.
PWRs and BWRs
The main design is the pressurised water reactor (PWR) which has
water in its primary cooling/heat transfer circuit, and generates
steam in a secondary circuit. The less popular boiling water
reactor (BWR) makes steam in the primary circuit above the reactor
core, though it is still under considerable pressure. Both
types use water as both coolant and moderator, to slow
neutrons.

Diagram of Pressurised Water Reactor
To maintain efficient reactor performance, about one-third or
half of the used fuel is removed every year or two, to be replaced
with fresh fuel.
The pressure vessel and any steam generators are housed in a
massive containment structure with reinforced concrete about 1.2
metres thick. This is to protect neighbours if there is a
major problem inside the reactor, and to protect the reactor from
external assaults.
Because some heat is generated from radioactive decay even after
the reactor is shut down, cooling systems are provided to remove
this heat as well as the main operational heat output.
Natural Prehistoric Reactors
The world's first nuclear reactors operated naturally in a
uranium deposit about two billion years ago in what is now
Gabon. The energy was not harnessed, since these were in rich
uranium orebodies in the Earth's crust and moderated by percolating
rainwater.
Nuclear energy's contribution to global electricity supply
Nuclear energy supplies some 14% of the world's electricity.
Today 31 countries use nuclear energy to generate up to three
quarters of their electricity, and a substantial number of these
depend on it for one quarter to one half of their supply. Almost
15,000 reactor-years of operational experience have been
accumulated since the 1950s by the world's 440 nuclear power
reactors (and nuclear reactors powering naval vessels have clocked
up a similar amount).
What are nuclear wastes and how are they managed?
http://www.world-nuclear.org/Nuclear-Basics/What-are-nuclear-wastes-/#.UhbaSX-N6So
The most significant high-level waste from a nuclear reactor is the
used nuclear fuel left after it has spent three years in the reactor
generating heat for electricity. Low-level waste is made up of
lightly-contaminated items like tools and work clothing from power plant
operation and makes up the bulk of radioactive wastes. Items disposed
of as intermediate-level wastes might include used filters, steel
components from within the reactor and some effluents from reprocessing.
By Volume
|
By Radioactive Content
|
|
High Level Waste
|
3%
|
95%
|
Intermediate Level Waste
|
7%
|
4%
|
Low Level Waste
|
90%
|
1%
|
High level wastes make just 3% of the total volume of waste arising
from nuclear generation, but they contain 95% of the radioactive
content. Low level wastes represent 90% of the total volume of
radioactive wastes, but contain only 1% of the radioactivity.
Managing used fuel
Used nuclear fuel is very hot and radioactive. Handling and storing
it safely can be done as long as it is cooled and plant workers are
shielded from the radiation it produces by a dense material like
concrete or steel.
Water can conveniently provide both cooling and shielding, so a
typical reactor will have its fuel removed underwater and
transferred to a storage pool. After about five years it can be
transferred into dry ventilated concrete containers, but otherwise
it can safely remain in the pool for up to 50 years.

Nuclear fuel storage pool
But this used fuel is also a valuable resource, and 96% of it
can be recycled. Currently, but means that the sustainability of nuclear power is
enhanced. In this case about 1% of the fuel is recycled
promptly into mixed oxide fuel (MOX), the rest is usually stored
for the future while about 3% of the original mass remains as waste
to be disposed of.
The high-level wastes (whether as used fuel after 50 years cooling,
or the separated 3% of such fuel) will be disposed of deep underground
in geological repositories.
Intermediate and low-level wastes
Intermediate- and
low-level wastes are disposed of closer to the surface, in many
established repositories. Low-level waste disposal sites are
purpose built, but are not much different from normal municipal
waste sites.
Nuclear power is not the only industry that creates radioactive wastes. Other
industries include medicine, particle and space research, oil and gas,
and mining - to name just a few. Some of these materials are not
produced inside a reactor, but rather are concentrated forms of
naturally occurring radioactive material.
Civil nuclear wastes from nuclear power plants have never caused any
harm, nor posed an environmental hazard, in over 50 years of the nuclear
power industry. Their management and eventual disposal is
straightforward.

Low-level and Intermediary-level waste (LLW/ILW) repository at TVO's Olkiluoto site in Finland.
One characteristic of all radioactive wastes which distinguishes
them from the very much larger amount of other toxic industrial
wastes is that their radioactivity progressively decays and
diminishes. For instance, after 40 years, the used fuel removed
from a reactor has only one thousandth of its initial radioactivity
remaining, making it very much easier to handle and dispose of.
Disposal
The categorization - high,
intermediate, low - helps determine how
wastes are treated and where they end up. All radioactive waste facilities are designed
with numerous layers of protection to make sure that the environment remains
protected for as long as it takes for radioactivity to reduce to background
levels. Low-level and intermediate
wastes are buried close to the surface. For low-level wastes disposal is not
much different from a normal municipal landfill. High-level wastes can remain
highly radioactive for thousands of years. They need to be disposed of hundreds
of metres underground in heavily engineered facilities built in stable
geological formations. While no such facilities currently exist, there
feasibility has been demonstrated and there are several countries now in the
process of designing and constructing them.
Number of nuclear reactors operable and under construction
http://www.world-nuclear.org/Nuclear-Basics/Global-number-of-nuclear-reactors/#.UhbbJX-N6So
There are currently 432 operable civil nuclear power nuclear reactors around the world, with a further 68 under construction.
(This under construction total recent changes including Shin Hanul 2,
Barakah 2, V.C. Summer 2 and Vogtle 3. The number of operable reactors
excludes Kewaunee, which shut down on 7 May 2013, and San Onofre 2 &
3).
A list of reactors operable, under construction, planned and proposed can be found in this information paper World Nuclear Power Reactors and Uranium Requirements.
Details of individual reactors operable and under construction can be
found in our Nuclear Reactor Database, which uses information supplied
by the International Atomic Energy Agency.
Why do different sources give slightly different figures?
There can be some variation in the assessment of the operational
status of a reactor. For example, the Monju reactor in Japan generated
electricity for a short time in 1994 and again in 2010. Some
organizations consider that Monju entered full operation and is current
in a period of long-term shutdown. Others consider that it is still
under construction. Also in Japan, although many reactors were
unaffected by the earthquake and tsunami of 3 March 2011 and continued
operations all had to eventually shut down for refuelling. However, only
two have been allowed to return to service, while others seek
permission to restart operations.These reactors are still counted as
operable by most sources, although others consider them to be in
long-term shutdown.
For reactors under construction there may be differences in
interpretation of when construction starts. Considerable construction
work is done prior to pouring first nuclear concrete. For example, some
considered the Vogtle 3 plant to already be under construction in late
2012, although at that time nuclear concrete had not been poured.
Construction can also stop, temporarily or permanently, on reactors.
Whether construction will restart and the plant enter operation can be
uncertain. In the US construction on the Watts Bar 2 reactor was stopped
in 1988, due to lower than expected demand. Construction restarted in
2007. In Russia construction stopped on the Khmelnitski 3 and 4 reactors
in 1990, but is now planned to restart.
Finally, with construction starting on new projects, new reactors
beginning operations and older reactors being retired throughout the
year figures may vary simply because they are updated more or less
frequently than others.
The following guide explains some of the definitions.
What is meant by "operable"
An operable reactor is one that is connected to the electricity grid.
In most cases these reactors will be generating and supplying
electricity to consumers. However, for short periods reactors don't
supply electricity to the grid, for example during a scheduled outage
for refuelling or maintenance.
What is meant by "under construction"
WNA uses the convention that a reactor is under construction only
once 'nuclear concrete' has been poured. This is concrete of a specific
grade or specification that is used in the construction of the nuclear
facilities on a reactor site. It would not include planned reactors when
site preparations are under way or concrete is being used for ancillary
buildings or cooling towers.
What is meant by "civil nuclear power reactors"
Civil nuclear power reactors are those reactors used to generate
electricity that is supplied to customers through electricity grids.
There are hundreds of other nuclear reactors in operation around the
world. These include research reactors used at universities and other
research establishments, reactors used to power ships and submarines and
reactors used to make medical isotopes.
Electricity Supplied by Nuclear Energy
In 2011 the world's nuclear reactors supplied 2518 TWh of electricity (2518 billion kilowatt hours)a. This represents around 13% of global electricity consumption.b
The percentage of electricity supplied by nuclear generation and
amount of electricity supplied in TWh for those countries with nuclear
generation in 2011 is shown below:
| Percentage share | Electricity Supplied TWh | |
|---|---|---|
| Argentina | 5 | 5.9 |
| Armenia | 33.2 | 2.4 |
| Belgium | 54 | 45.9 |
| Brazil | 3.2 | 14.8 |
| Bulgaria | 32.6 | 15.3 |
| Canada | 15.3 | 88.3 |
| China Mainland | 1.8 | 82.6 |
| Czech Rep | 33 | 26.7 |
| Finland | 31.6 | 31.6 |
| France | 77.7 | 423.5 |
| Germany | 17.8 | 102.3 |
| Hungary | 43.2 | 14.7 |
| India | 3.7 | 28.9 |
| Japan | 18.1 | 156.2 |
| Mexico | 3.6 | 9.3 |
| Netherlands | 3.6 | 3.9 |
| Pakistan | 3.8 | 3.8 |
| Romania | 19 | 10.8 |
| Russia | 17.6 | 162.0 |
| Slovakia | 54 | 14.3 |
| Slovenia | 41.7 | 5.9 |
| South Africa | 5.2 | 12.9 |
| South Korea | 34.6 | 147.8 |
| Spain | 19.5 | 55.1 |
| Sweden | 39.6 | 58.1 |
| Switzerland | 40.8 | 25.7 |
| Taiwan | 19 | 40.4 |
| UK | 17.8 | 62.7 |
| Ukraine | 47.2 | 84.9 |
| USA | 19.2 | 790.4 |
Past values for nuclear shares of electricity production are given in the Information Library document Nuclear generation by country
Sources
a) IAEA PRIS database http://www.iaea.org/PRIS/WorldStatistics/WorldTrendinElectricalProduction.aspx
b) CIA The World Factbook https://www.cia.gov/library/publications/the-world-factbook/geos/xx.html.
Greenhouse gas emissions avoided through use of nuclear energy
There are many different electrical generation methods, each having
advantages and disadvantages with respect to operational cost,
environmental impact, and other factors.
In relation to greenhouse gas (GHG) emissions, each generation
method produces GHGs in varying quantities through construction,
operation (including fuel supply activities), and decommissioning.
Some generation methods such as coal fired power plants release the
majority of GHGs when their carbon-containing fossil fuels are burnt,
producing carbon dioxide (CO2). Others, such as wind power
and nuclear power, give rise to much less emissions, these being during
construction and decommissioning, or mining and fuel preparation in the
case of nuclear.
Accounting for emissions from all phases of the project
(construction, operation, and decommissioning) is called a lifecycle
approach. Comparing the lifecycle emissions of electrical generation
allows for a fair comparison of the different generation methods on a
per kilowatt-hour basis. The lower the value, the fewer GHG emissions
are released.
WNA has carried out a review of
over twenty studies assessing the greenhouse gas emission produced by
different forms of electricity generation. The results summarised in the
chart below show that generating electricity from fossil fuels results
in greenhouse gas emissions far higher than when using nuclear or
renewable generation.

In 2011 the world's nuclear power plants supplied 2518 TWh (billion
kWh) of electricity. The following table shows the additional emissions
that would have been produced if fossil fuels had been used to generate
the same amount of electricity.
| Average lifecycle GHG emissions (tonnes/GWh) | Emissions produced from generating 2518 TWh of electricity | Additional emissions avoided through use of nuclear electricity in place of fossil fuel | |
|---|---|---|---|
| Lignite | 1054 | 2654 million tonnes CO2 | 2581 million tonnes CO2 |
| Coal | 888 | 2236 million tonnes CO2 | 2163 million tonnes CO2 |
| Oil | 733 | 1846 million tonnes CO2 | 1773 million tonnes CO2 |
| Natural Gas | 499 | 1256 million tonnes CO2 | 1183 million tonnes CO2 |
| Nuclear | 29 | 73 million tonnes CO2 | - |
Comparison of emissions from nuclear and renewable generation
The WNA review of lifecycle emissions from nuclear and renewable
generation showed that lifecycle emissions from all the major forms of
renewables (solar, wind, biomass, hydroelectric) and nuclear were
similiar. Replacing generation from nuclear or renewables with fossil
fuels would lead to similar rises in greenhouse gas emissions.
Sources
WNA Report: Comparison of Lifecycle Greenhouse Gas Emissions of Various Electricity Generation SourcesIAEA PRIS database http://www.iaea.org/PRIS/WorldStatistics/WorldTrendinElectricalProduction.aspx
CIA The World Factbook https://www.cia.gov/library/publications/the-world-factbook/geos/xx.html.
Other Uses of Nuclear Technology
Nuclear technology is not just used to supply electricity to the
grid; it is in a wide variety of other uses such as medicine,
heating and space travel.
Nuclear Medicine

Nuclear
medicine uses radiation to allow doctors to make a quick, accurate
diagnosis of the functioning of person's specific organs, or to
treat them. Radiotherapy can be used to treat some medical
conditions, especially cancer, using radiation to weaken or destroy
particular targeted cells.
Tens of millions of patients are treated with nuclear medicine each year
Over 10,000 hospitals worldwide use radioisotopes in medicine, and about 90% of the procedures are for diagnosis. The most common radioisotope used in diagnosis is technetium-99, with some 30 million procedures per year, accounting for 80% of all nuclear medicine procedures worldwide.
Modern industry also uses radioisotopes in a variety of ways.
Sealed radioactive sources are used in industrial radiography,
gauging applications and mineral analysis.Over 10,000 hospitals worldwide use radioisotopes in medicine, and about 90% of the procedures are for diagnosis. The most common radioisotope used in diagnosis is technetium-99, with some 30 million procedures per year, accounting for 80% of all nuclear medicine procedures worldwide.
Heat for Desalination
Heat from nuclear reactors can be used directly, instead or as well
as being used to generate electricity. This heat can be used for
district heating, as process heat for industry or for desalination
plants, used to make clean drinkable water from seawater.
Space Missions
 Radioisotope
thermal generators are used in space missions. The heat generated
by the decay of a radioactive source, often Plutonium-238, is used
to generate electricity. The Voyager space probes, the Cassini
mission to Saturn, the Galileo mission to Jupiter and the New
Horizons mission to Pluto all are powered by RTGs. The Spirit and
Opportunity Mars rovers have used a mix of solar panels for
electricity and RTGs for heat. The latest Mars rover, Curiosity, is
much bigger and uses RTGs for heat and electricity as solar
panels would not be able to supply enough electricity.
Radioisotope
thermal generators are used in space missions. The heat generated
by the decay of a radioactive source, often Plutonium-238, is used
to generate electricity. The Voyager space probes, the Cassini
mission to Saturn, the Galileo mission to Jupiter and the New
Horizons mission to Pluto all are powered by RTGs. The Spirit and
Opportunity Mars rovers have used a mix of solar panels for
electricity and RTGs for heat. The latest Mars rover, Curiosity, is
much bigger and uses RTGs for heat and electricity as solar
panels would not be able to supply enough electricity.
In the future electricity or heat from nuclear power plants could
be used to make hydrogen. Hydrogen can be used in fuel cells to
power cars, or can be burnt to provide heat in place of gas,
without producing emissions that would cause climate change.
The Nuclear Industry
http://www.world-nuclear.org/Nuclear-Basics/The-Nuclear-Industry/#.UhbdWX-N6SoThe nuclear industry is global, and comprises many diverse participants from individuals to companies, industry associations to UN and other inter-governmental bodies, and also appointed bodies responsible to national governments.
Nuclear reactor builders and operators
Central to it are the companies and government corporations or
utilities set up to generate electricity. These are usually also
responsible for building the nuclear power plants, and draw upon reactor
and other vendor companies and a wide range of contractors to achieve
this.
Mines, Nuclear Fuel, Storage and Waste
Servicing the electricity generation are companies providing fuel.
These range from mining companies through companies providing services
to prepare the fuel for use in reactors – conversion, enrichment and
fuel fabrication are the three main categories.
After the fuel is used in a reactor it is initially stored there, but
another range of service companies then play roles in management,
possibly reprocessing, and disposal of final wastes.
Most of these companies have a technology or engineering base, but
there are also trading companies involved with fuel supply, connecting
these.

Regulators
Any major industry in any country is subject to regulation by
governments, and for nuclear power the national regulators appointed by
them play an important role in approving the technology used, where it
is sited, and how it is operated.
Research and Development
Behind all the above front-line roles are organisations responsible
for research and development (R&D), for setting engineering
standards, and for design of equipment.
Finance
Nuclear plants need a lot of investment to build, and the financial
services sector has a vital role in providing finance for capital works.
Related to this are insurance of plants and third party liability
insurance, without which plants cannot operate.
The industry as a whole receives income through the sales of electricity generated in its nuclear power plants.
National and International Organisations
Beyond the role of national governments is that of the UN’s
International Atomic Energy Agency (IAEA) which is responsible for
implementing international agreements specific to nuclear power, notably
the Nuclear Non-Proliferation Treaty (NPT) which enables international
collaboration on the peaceful uses of atomic energy while providing
mutual assurance that civil programs remain so.
At a less formal level there is a lot of international collaboration
through the World Association of Nuclear Operators (WANO) which plays a
major role in improving the safety and reliability of reactor operation
and keeping it at a high standard. In some countries there are
corresponding national organisations linking different operators.
The World Nuclear Association (WNA) is the international trade
association linking companies and organisations worldwide to address
matters of common concern collaboratively. In each country and for
Europe collectively there are corresponding industry associations which
have a mutual support and lobbying function to interface with
governments.
All this adds up to a major and diverse collections of corporate and
government players who together make the industry function efficiently.
Glossary
(updated January 2011)
The following is a list of terms which are commonly used in discussion of the the nuclear fuel cycle.
Actinide:
An element with atomic number of 89 (actinium) to 103. Usually applied
to those above uranium - 93 up (also called transuranics). Actinides are
radioactive and typically have long half-lives. They are therefore
significant in wastes arising from nuclear fission, e.g. used fuel. They
are fissionable in a fast reactor. Minor actinides are americium,
curium and neptunium.
Activation product: A radioactive isotope of an element (e.g. in the steel of a reactor core) which has been created by neutron bombardment.
Activity: The number of disintegrations per unit time inside a radioactive source. Expressed in becquerels.
ALARA: As Low
As Reasonably Achievable, economic and social factors being taken into
account. This is the optimisation principle of radiation protection.
Alpha particle:
A positively-charged particle emitted from the nucleus of an atom
during radioactive decay. Alpha particles are helium nuclei, with 2
protons and 2 neutrons.
Atom: A particle
of matter which cannot be broken up by chemical means. Atoms have a
nucleus consisting of positively-charged protons and uncharged neutrons
of almost the same mass. The positive charges on the protons are
balanced by a number of negatively-charged electrons in motion around
the nucleus.
Background radiation:
The naturally-occurring ionising radiation which every person is
exposed to, arising from the earth's crust (including radon) and from
cosmic radiation.
Barn: see Cross section.
Base load:
That part of electricity demand which is continuous, and does not vary
over a 24-hour period. Approximately equivalent to the minimum daily
load.
Becquerel:
The SI unit of intrinsic radioactivity in a material. One Bq indicates
one disintegration per second and is thus the activity of a quantity of
radioactive material which averages one decay per second. (In practice,
GBq or TBq are the common units).
Beta particle:
A particle emitted from an atom during radioactive decay. Beta
particles are generally electrons (with negative charge) but may be
positrons.
Biological shield:
A mass of absorbing material (eg thick concrete walls) placed around a
reactor or radioactive material to reduce the radiation (especially
neutrons and gamma rays respectively) to a level safe for humans.
Boiling water reactor (BWR):
A common type of light water reactor (LWR), where water is allowed to
boil in the core thus generating steam directly in the reactor vessel. (cf PWR)
Breed: To form fissile nuclei, usually as a result of neutron capture, possibly followed by radioactive decay.
Burn: The process of undergoing fission (analogous to burning a fossil fuel) or otherwise becoming denatured in the reactor core.
Burnable absorber, burnable poison:
A neutron absorber included in the fuel which progressively disappears
and compensates for the loss of reactivity as the fuel is consumed.
Gadolinium is commonly used, and erbium may also be used.
Burnup: Measure of thermal energy released by nuclear fuel relative to its mass, typically Gigawatt days per tonne of fuel (GWd/t).
Calandria:
(in a PHWR reactor) a cylindrical reactor vessel which contains the
heavy water moderator. It is penetrated from end to end by hundreds of
calandria tubes which accommodate the pressure tubes containing the fuel
and coolant.
CANDU:
CANadian Deuterium Uranium reactor, moderated and cooled by heavy water
(except for the ACR design, which is cooled by light water). These are
the most common PHWRs (cf heavy water reactor).
Centrifuge:
A cylinder spinning at high speed to physically separate gas components
of slightly different mass, e.g. uranium hexafluoride with U-235 and
U-238 atoms.
Chain reaction:
A reaction that stimulates its own repetition, in particular where the
neutrons originating from nuclear fission cause an ongoing series of
fission reactions.
Cladding: The metal tubes containing oxide fuel pellets (cf zircaloy).
Concentrate: See Uranium oxide concentrate (U3O8).
Control rods:
Devices to absorb neutrons so that the chain reaction in a reactor core
may be slowed or stopped by inserting them further, or accelerated by
withdrawing them.
Conversion: Chemical process turning U3O8 into UF6 preparatory to enrichment.
Conversion ratio:
(in a nuclear reactor) the ratio of new fissile nuclei to fissioned
nuclei. In a normal reactor this as around 0.6, at high neutron energy
in a fast reactor it may exceed 1.0, due to more neutrons per fission,
making it a net breeder. (Above about 0.1 MeV, ie fast neutron spectrum,
the number of neutrons released per fission increases from around 2.5,
and at 10 MeV it reaches about 4.)
Coolant: The liquid or gas used to transfer heat from the reactor core to the steam generators or directly to the turbines.
Core: The central part of a nuclear reactor containing the fuel elements and any moderator.
Critical mass: The smallest mass of fissile material that will support a self-sustaining chain reaction under specified conditions.
Criticality: Condition of being able to sustain a nuclear chain reaction.
Cross section: see neutron cross-section.
Decay:
Disintegration of atomic nuclei resulting in the emission of alpha or
beta particles (usually with gamma radiation). Also the exponential
decrease in radioactivity of a material as nuclear disintegrations take
place and more stable nuclei are formed.
Decommissioning:
Removal of a facility (eg reactor) from service, also the subsequent
actions of safe storage, dismantling and making the site available for
unrestricted use.
Deconversion: The chemical process of turning UF6 into uranium oxide. Typically depleted UF6 may be processed for long-term storage in a more stable chemical form. HF is a by-product.
Delayed neutrons:
neutrons released by fission products up to several seconds after
fission. These enable control of the fission in a nuclear reactor.
Depleted uranium:
Uranium having less than the natural 0.7% U-235. As a by-product of
enrichment in the fuel cycle it generally has 0.25-0.30% U-235, the rest
being U-238. Can be blended with highly-enriched uranium (eg from
weapons) to make reactor fuel.
Deuterium:
"Heavy hydrogen", a stable isotope having one proton and one neutron in
the nucleus. It occurs in nature as 1 atom to 6500 atoms of normal
hydrogen, (Hydrogen atoms contain one proton and no neutrons).
Disintegration:
natural change in the nucleus of a radioactive isotope as particles are
emitted (usually with gamma rays), making it a different element.
Dose: The energy
absorbed by tissue from ionising radiation. One gray is one joule per
kg, but this is adjusted for the effect of different kinds of radiation,
and thus the sievert is the unit of dose equivalent used in setting
exposure standards.
Electron volt: 1.6 x 10⁻¹⁹
joules, the amount of kinetic energy gained by a single electron when
it accelerates through an electrostatic potential difference of one
volt.
Element: A
chemical substance that cannot be divided into simpler substances by
chemical means; atomic species with same number of protons (being the
atomic number of the element).
Enriched uranium:
Uranium in which the proportion of U-235 (to U-238) has been increased
above the natural 0.7%. Reactor-grade uranium is usually enriched to
about 3.5% U-235, weapons-grade uranium is more than 90% U-235.
Enrichment: Physical process of increasing the proportion of U-235 to U-238. See also SWU.
Fast breeder reactor (FBR):
A fast neutron reactor (q.v.) configured to produce more fissile
material than it consumes, using fertile material such as depleted
uranium in a blanket around the core.
Fast neutron: neutron released during fission, travelling at very high velocity (20,000 km/s) and having high energy (c 2 MeV).
Fast neutron reactor:
A reactor with no moderator and hence utilising fast neutrons. It
normally burns plutonium while producing fissile isotopes in fertile
material such as depleted uranium (or thorium).
Fertile (of an isotope): Capable of becoming fissile, by capturing neutrons, possibly followed by radioactive decay; eg U-238, Pu-240.
Fissile (of an isotope): Capable of capturing a slow (thermal) neutron and undergoing nuclear fission, e.g. U-235, U-233, Pu-239.
Fission:
The splitting of a heavy nucleus into two, accompanied by the release of
a relatively large amount of energy and usually one or more neutrons.
It may be spontaneous but usually is due to a nucleus absorbing a
neutron and thus becoming unstable.
Fissionable (of an isotope): Capable of undergoing fission: If fissile, by slow neutrons; otherwise, by fast neutrons.
Fission products:
'Daughter' nuclei resulting either from the fission of heavy elements
such as uranium, or the radioactive decay of those primary daughters.
Usually highly radioactive.
Fossil fuel: A fuel based on carbon presumed to be originally from living matter, eg coal, oil, gas. Burned with oxygen to yield energy.
Fuel assembly: Structured collection of fuel rods or elements, the unit of fuel in a reactor.
Fuel fabrication: Making reactor fuel assemblies, usually from sintered UO2 pellets which are inserted into zircalloy tubes, comprising the fuel rods or elements.
Gamma rays: High energy electro-magnetic radiation from the atomic nucleus, virtually identical to X-rays.
Genetic mutation:
Sudden change in the chromosomal DNA of an individual gene. It may
produce inherited changes in descendants. Mutation in some organisms can
be made more frequent by irradiation (though this has never been
demonstrated in humans).
Giga: One billion units (eg one gigawatt is 109 watts or one million kW).
Graphite:
Crystalline carbon used in very pure form as a moderator, principally
in gas-cooled reactors, but also in Soviet-designed RBMK reactors.
Gray (Gy): The SI unit of absorbed radiation dose, one joule per kilogram of tissue.
Greenhouse gases:
Radiative gases in the Earth's atmosphere which absorb long-wave heat
radiation from the Earth's surface and re-radiate it, thereby warming
the Earth. Carbon dioxide, methane and water vapour are the main ones.
Half-life:The period required for half of the atoms of a particular radioactive isotope to decay and become an isotope of another element.
Heavy water: Water containing an elevated concentration of molecules with deuterium ("heavy hydrogen") atoms.
Heavy water reactor (HWR): A reactor which uses heavy water as its moderator, eg Canadian CANDU (q.v.) which is a pressurised HWR (PHWR).
High-level wastes (HLW):
Extremely radioactive fission products and transuranic elements
(usually other than plutonium) in used nuclear fuel. They may be
separated by reprocessing the used fuel, or the spent fuel containing
those isotopes may be regarded as high-level waste. HLW requires both
shielding and cooling.
High-enriched uranium (HEU): Uranium enriched to 20% U-235 or more. (That in weapons is about 90% U-235.)
In situ leaching (ISL):
The recovery by chemical leaching of minerals from porous orebodies
without physical excavation. Also known as in situ recovery (ISR) or
solution mining.
Intermediate-level waste (ILW): Radioactive waste which requires shielding to protect people nearby, but not cooling.
Ion: An atom or molecule that is electrically-charged because of loss or gain of electrons.
Ionising radiation:
Radiation (including alpha particles) capable of breaking chemical
bonds, thus causing ionisation of the matter through which it passes and
damage to living tissue.
Irradiate:
Subject material to ionising radiation. Irradiated reactor fuel and
components have been subject to neutron irradiation and hence become
radioactive themselves.
Isotope: An
atomic form of an element having a particular number of neutrons.
Different isotopes of an element have the same number of protons but
different numbers of neutrons and hence different atomic masses, eg.
U-235, U-238. Some isotopes are unstable and decay (qv) to form isotopes
of other elements.
Laser enrichment: Uranium enrichment using tuned laser beams to cause photo-dissociation of UF6 to solid UF5+ so that the ionised UF5 (with U-235) can be separated.
Light water: Ordinary water (H20) as distinct from heavy water.
Light water reactor (LWR):
A common nuclear reactor cooled and usually moderated by ordinary
water. It is s generic designation including BWR and PWR types.
Low-enriched uranium (LEU): Uranium enriched to less than 20% U-235. (That in power reactors is usually 3.5 - 5.0% U-235.)
Low-level wastes: Mildly radioactive material usually disposed of by incineration and burial.
Low-level waste (LLW): Radioactive waste which can be handled safely without shielding.
Megawatt (MW): A unit of power, = 106 watts. MWe refers to electric output from a generator, MWt
to thermal output from a reactor or heat source (eg the gross heat
output of a reactor itself, typically around three times the MWe
figure).
Metal fuels: Fuels using natural uranium metal, as used in a gas-cooled reactor.
Micro: one millionth of a unit (eg microsievert is 10-6 Sv).
Milling: Process by which minerals are extracted from ore, usually at the mine site, to produce a mineral concentrate for sale.
Mixed oxide fuel (MOX): Reactor fuel which consists of both uranium and plutonium oxides, usually about 5% Pu, which is the main fissile component.
Moderator:
A material such as light or heavy water or graphite used in a reactor
to slow down fast neutrons by collision with lighter nuclei so as to
expedite further fission.
Natural uranium:
Uranium with an isotopic composition as found in nature, containing
99.3% U-238, 0.7% U-235 and a trace of U-234. It can be used as fuel in
heavy water-moderated or graphite-moderated reactors.
Neutron: An
uncharged elementary particle found in the nucleus of every atom except
hydrogen. Solitary mobile neutrons travelling at various speeds
originate from fission reactions. Slow (thermal) neutrons can in turn
readily cause fission in nuclei of "fissile" isotopes, e.g. U-235,
Pu-239, U-233; and fast neutrons can cause fission in nuclei of
"fertile" isotopes such as U-238, Pu-239. Sometimes atomic nuclei simply
capture neutrons.
Neutron cross-section: An indication of the probability of an interaction between a particle and a target nucleus, expressed in barns (1 barn = 10-24 cm2).
Nuclear reactor:
A device in which a nuclear fission chain reaction occurs under
controlled conditions so that the heat yield can be harnessed or the
neutron beams utilised. All commercial reactors are thermal reactors,
using a moderator to slow down the neutrons.
Nuclide:
elemental matter made up of atoms with identical nuclei, therefore with
the same atomic number and the same mass number (equal to the sum of the
number of protons and neutrons).
Oxide fuels: Enriched or natural uranium in the form of the oxide UO2, used in many types of reactor.
Operation and Maintenance (O&M) costs: The operational costs of running a nuclear power plant excluding fuel and any capital costs.
Plutonium:
A transuranic element, formed in a nuclear reactor by neutron capture.
It has several isotopes, some of which are fissile and some of which
undergo spontaneous fission, releasing neutrons. Weapons-grade plutonium
is produced in special reactors to give >90% Pu-239, reactor-grade
plutonium contains about 30% non-fissile isotopes. About one third of
the energy in a light water reactor comes from the fission of Pu-239,
and this is the main isotope of value recovered from reprocessing used
fuel.
Pressurised water reactor (PWR):
The most common type of light water reactor (LWR), it uses water at
very high pressure in a primary circuit and steam is formed in a
secondary circuit.
Radiation: The emission and propagation of energy by means of electromagnetic waves or particles. (cf ionising radiation)
Radioactivity: The spontaneous decay of an unstable atomic nucleus, giving rise to the emission of radiation.
Radionuclide: A radioactive isotope of an element.
Radiotoxicity: The adverse health effect of a radionuclide due to its radioactivity.
Radium: A
radioactive decay product of uranium often found in uranium ore. It has
several radioactive isotopes. Radium-226 decays to radon-222.
Radon (Rn): A
heavy radioactive gas given off by rocks containing radium (or thorium).
Rn-222 is the main isotope, from decay of radium-226.
Radon daughters: Short-lived decay products of radon-222 (Po-218, Pb-214, Bi-214, Po-214).
Reactor pressure vessel: The main steel vessel of a nuclear reactor containing the reactor fuel, moderator and coolant under pressure.
Repository: A permanent disposal place for radioactive wastes.
Reprocessing:
Chemical treatment of used reactor fuel to separate uranium and
plutonium and possibly transuranic elements from the small quantity of
fission products, leaving a much reduced quantity of high-level waste. (cf Waste, HLW).
Separative Work Unit (SWU):
This is a complex unit which is a function of the amount of uranium
processed and the degree to which it is enriched, ie the extent of
increase in the concentration of the U-235 isotope relative to the
remainder. The unit is strictly: Kilogram Separative Work Unit, and it
measures the quantity of separative work (indicative of energy used in
enrichment) when feed and product quantities are expressed in kilograms.
Eg, to produce one kilogram of uranium enriched to 3.5% U-235
requires 4.3 SWU if the plant is operated at a tails assay 0.30%, or 4.8
SWU if the tails assay is 0.25% (thereby requiring only 7.0 kg instead
of 7.8 kg of natural U feed).
About 100-120,000 SWU is required to enrich the annual fuel loading
for a typical 1000 MWe light water reactor. Enrichment costs are related
to electrical energy used. The gaseous diffusion process consumes some
2400 kWh per SWU, while gas centrifuge plants require only about 60
kWh/SWU.
Sievert (Sv):
Unit indicating the biological damage caused by radiation dose measured
in Gray (q.v.). One Gray of beta or gamma radiation absorbed has 1 Sv
of biological effect; 1 Gy of alpha radiation has 20 Sv effect and 1 Gy
of neutrons has 10 Sv effect. cf Dose.
Spallation:
the abrasion and removal of fragments of a target which is bombarded by
protons in an accelerator. The fragments may be protons, neutrons or
other light particles.
Spent fuel:
Used fuel assemblies removed from a reactor after several years use and
treated as waste. Often it is another term for used fuel.
Stable: Incapable of spontaneous radioactive decay.
Tailings: Ground rock remaining after particular ore minerals (e.g. uranium oxides) are extracted.
Tails: Depleted uranium (cf. enriched uranium), with about 0.2 to 0.3% U-235.
Temperature coefficient of reactivity:
The change in reactivity due to changed temperature in the fuel. A
negative temperature coefficient means that the reactivity is diminished
as the temperature rises, so as to reduce the rate of fission and hence
reduce the temperature - a natural negative feedback. Fast reactors
have a strong negative temperature coefficient which is the basis of
automatic power regulation and even load-following.
Thermal reactor: A reactor in which the fission chain reaction is sustained primarily by slow neutrons, and hence requiring a moderator (as distinct from Fast Neutron Reactor).
Transmutation:
Changing atoms of one element into those of another by neutron
bombardment, causing neutron capture and/or fission. In an ordinary
reactor neutron capture is the main event, in a fast reactor fission is
more common and therefore it is best for dealing with actinides. Fission
product transmutation is by neutron capture.
Transuranic element:
A very heavy element formed artificially by neutron capture and
possibly subsequent beta decay(s). Has a higher atomic number than
uranium (92). All are radioactive. Neptunium, plutonium, americium and
curium are the best-known.
Uranium (U):
A mildly radioactive element with two isotopes which are fissile (U-235
and U-233) and two which are fertile (U-238 and U-234). Uranium is the
basic fuel of nuclear energy.
Uranium hexafluoride (UF6): A compound of uranium which is a gas above 56°C and is thus a suitable form in which to enrich the uranium.
Uranium oxide concentrate (U3O8):
The mixture of uranium oxides produced after milling uranium ore from a
mine. Sometimes loosely called yellowcake. It is khaki in colour and is
usually represented by the empirical formula U3O8. Uranium is normally sold in this form.
Used fuel: Fuel assemblies removed from a reactor after several years' use.
Vitrification:
The incorporation of high-level wastes into borosilicate glass, to make
up about 14% of it by mass. It is designed to immobilise radionuclides
in an insoluble matrix ready for disposal.
Void coefficient of reactivity:
The change in reactivity due to boiling of coolant or moderator in the
actual core. A negative void coefficient means that the reactivity is
diminished, and the blanace of the chain reaction is affected so as to
reducte the rate of fission and hence reduce the temperature - a natural
negative feedback.
Waste:
High-level waste (HLW) is highly radioactive material arising from nuclear fission. It can be what is left over from reprocessing used fuel, though some countries regard spent fuel itself as HLW. It requires very careful handling, storage and disposal.
High-level waste (HLW) is highly radioactive material arising from nuclear fission. It can be what is left over from reprocessing used fuel, though some countries regard spent fuel itself as HLW. It requires very careful handling, storage and disposal.
Intermediate-level waste (ILW) comprises a range of
materials from reprocessing and decommissioning. It is sufficiently
radioactive to require shielding and is disposed of in engineered
facilities underground.
Low-level waste (LLW) is mildly radioactive material usually disposed of by incineration and burial.
Yellowcake: Ammonium diuranate, the penultimate uranium compound in U3O8 production, but the form in which mine product was sold until about 1970. See also Uranium oxide concentrate.
Zircaloy: Zirconium alloy used as a tube to contain uranium oxide fuel pellets in a fuel rod (part of a reactor fuel assembly).
Tidak ada komentar:
Posting Komentar